


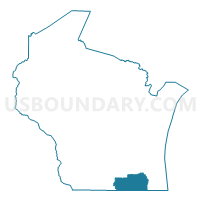
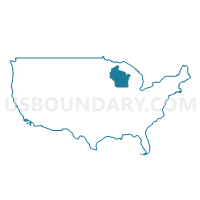
Congressional District 1, Wisconsin
About
Outline

Summary
| Unique Area Identifier | 118744 |
| Name | Congressional District 1 |
| State | Wisconsin |
| Area (square miles) | 1,722.73 |
| Land Area (square miles) | 1,675.42 |
| Water Area (square miles) | 47.30 |
| % of Land Area | 97.25 |
| % of Water Area | 2.75 |
| Latitude of the Internal Point | 42.70000080 |
| Longtitude of the Internal Point | -88.37841360 |
| Total Population | 728,042 |
| Total Housing Units | 315,935 |
| Total Households | 284,605 |
| Median Age | 39.2 |
Maps
Graphs
Select a template below for downloading or customizing gragh for Congressional District 1, Wisconsin


Neighbors
Neighoring 111th Congressional District (by Name) Neighboring 111th Congressional District on the Map
- Congressional District 16, IL
- Congressional District 2, WI
- Congressional District 4, WI
- Congressional District 5, WI
- Congressional District 8, IL
Top 10 Neighboring County (by Population) Neighboring County on the Map
- Milwaukee County, WI (947,735)
- Lake County, IL (703,462)
- Dane County, WI (488,073)
- Waukesha County, WI (389,891)
- McHenry County, IL (308,760)
- Winnebago County, IL (295,266)
- Racine County, WI (195,408)
- Kenosha County, WI (166,426)
- Rock County, WI (160,331)
- Walworth County, WI (102,228)
Top 10 Neighboring County Subdivision (by Population) Neighboring County Subdivision on the Map
- Milwaukee city, Milwaukee County, WI (594,833)
- Kenosha city, Kenosha County, WI (99,218)
- Racine city, Racine County, WI (78,860)
- Janesville city, Rock County, WI (63,575)
- West Allis city, Milwaukee County, WI (60,411)
- New Berlin city, Waukesha County, WI (39,584)
- Beloit city, Rock County, WI (36,966)
- Greenfield city, Milwaukee County, WI (36,720)
- Franklin city, Milwaukee County, WI (35,451)
- Oak Creek city, Milwaukee County, WI (34,451)
Top 10 Neighboring Place (by Population) Neighboring Place on the Map
- Milwaukee city, WI (594,833)
- Kenosha city, WI (99,218)
- Racine city, WI (78,860)
- Janesville city, WI (63,575)
- West Allis city, WI (60,411)
- New Berlin city, WI (39,584)
- Beloit city, WI (36,966)
- Greenfield city, WI (36,720)
- Franklin city, WI (35,451)
- Oak Creek city, WI (34,451)
Top 10 Neighboring Elementary School District (by Population) Neighboring Elementary School District on the Map
- Antioch Community Consolidated School District 34, IL (23,861)
- Beach Park Community Consolidated School District 3, IL (20,315)
- Lake Geneva Joint No. 1 School District, WI (16,995)
- Waterford Joint No. 1 School District, WI (13,791)
- Nippersink School District 2, IL (11,686)
- Salem School District, WI (9,270)
- Winthrop Harbor School District 1, IL (6,628)
- Union Grove Joint No. 1 School District, WI (5,388)
- Randall Joint No. 1 School District, WI (5,299)
- Genoa City Joint No. 2 School District, WI (5,155)
Top 10 Neighboring Secondary School District (by Population) Neighboring Secondary School District on the Map
- Antioch Community High School District 117, IL (45,037)
- Zion-Benton Township High School District 126, IL (44,411)
- Hononegah Community High School District 207, IL (33,193)
- Lake Geneva-Genoa City Union High School District, WI (24,175)
- Westosha Central High School District, WI (19,682)
- Wilmot Union High School District, WI (18,722)
- Waterford Union High School District, WI (18,322)
- Union Grove Union High School District, WI (13,326)
- Richmond-Burton Community High School District 157, IL (11,686)
- Big Foot Union High School District, WI (9,660)
Top 10 Neighboring Unified School District (by Population) Neighboring Unified School District on the Map
- Milwaukee School District, WI (594,784)
- Racine School District, WI (139,193)
- Kenosha School District, WI (127,931)
- Waukesha School District, WI (93,322)
- West Allis School District, WI (68,217)
- Janesville School District, WI (63,003)
- Oak Creek-Franklin School District, WI (38,778)
- Beloit School District, WI (36,790)
- New Berlin School District, WI (35,110)
- Muskego-Norway School District, WI (29,204)
Top 10 Neighboring State Legislative District Lower Chamber (by Population) Neighboring State Legislative District Lower Chamber on the Map
- State House District 69, IL (123,633)
- State House District 63, IL (122,290)
- State House District 61, IL (120,629)
- Assembly District 31, WI (61,767)
- Assembly District 65, WI (61,608)
- Assembly District 66, WI (61,567)
- Assembly District 83, WI (61,206)
- Assembly District 9, WI (60,880)
- Assembly District 21, WI (60,177)
- Assembly District 32, WI (60,152)
Top 10 Neighboring State Legislative District Upper Chamber (by Population) Neighboring State Legislative District Upper Chamber on the Map
- State Senate District 32, IL (254,707)
- State Senate District 35, IL (245,609)
- State Senate District 31, IL (237,963)
- State Senate District 11, WI (181,372)
- State Senate District 22, WI (180,019)
- State Senate District 28, WI (177,466)
- State Senate District 13, WI (175,277)
- State Senate District 7, WI (172,003)
- State Senate District 3, WI (171,321)
- State Senate District 15, WI (170,251)
Top 10 Neighboring Census Tract (by Population) Neighboring Census Tract on the Map
- Census Tract 1603, Milwaukee County, WI (9,582)
- Census Tract 40.01, Winnebago County, IL (9,015)
- Census Tract 1501, Milwaukee County, WI (8,972)
- Census Tract 26.02, Kenosha County, WI (8,602)
- Census Tract 26.01, Kenosha County, WI (8,493)
- Census Tract 8601.01, Lake County, IL (8,492)
- Census Tract 13.04, Rock County, WI (8,084)
- Census Tract 6.02, Kenosha County, WI (7,910)
- Census Tract 31, Rock County, WI (7,581)
- Census Tract 1204, Milwaukee County, WI (7,312)
Top 10 Neighboring 5-Digit ZIP Code Tabulation Area (by Population) Neighboring 5-Digit ZIP Code Tabulation Area on the Map
- 53215, WI (60,953)
- 53511, WI (48,929)
- 53221, WI (37,701)
- 53207, WI (35,149)
- 53132, WI (34,863)
- 53154, WI (34,451)
- 53219, WI (33,880)
- 53402, WI (33,174)
- 53142, WI (32,375)
- 53151, WI (31,987)
Data
Demographic, Population, Households, and Housing Units
** Data sources from census 2010 **
Show Data on Map
Download Full List as CSV
Download Quick Sheet as CSV
| Subject | This Area | Wisconsin | National |
|---|---|---|---|
| POPULATION | |||
| Total Population Map | 728,042 | 5,686,986 | 308,745,538 |
| POPULATION, HISPANIC OR LATINO ORIGIN | |||
| Not Hispanic or Latino Map | 662,194 | 5,350,930 | 258,267,944 |
| Hispanic or Latino Map | 65,848 | 336,056 | 50,477,594 |
| POPULATION, RACE | |||
| White alone Map | 631,694 | 4,902,067 | 223,553,265 |
| Black or African American alone Map | 39,254 | 359,148 | 38,929,319 |
| American Indian and Alaska Native alone Map | 2,956 | 54,526 | 2,932,248 |
| Asian alone Map | 12,308 | 129,234 | 14,674,252 |
| Native Hawaiian and Other Pacific Islander alone Map | 260 | 1,827 | 540,013 |
| Some Other Race alone Map | 25,970 | 135,867 | 19,107,368 |
| Two or More Races Map | 15,600 | 104,317 | 9,009,073 |
| POPULATION, SEX | |||
| Male Map | 360,215 | 2,822,400 | 151,781,326 |
| Female Map | 367,827 | 2,864,586 | 156,964,212 |
| POPULATION, AGE (18 YEARS) | |||
| 18 years and over Map | 550,500 | 4,347,494 | 234,564,071 |
| Under 18 years | 177,542 | 1,339,492 | 74,181,467 |
| POPULATION, AGE | |||
| Under 5 years | 45,221 | 358,443 | 20,201,362 |
| 5 to 9 years | 48,993 | 368,617 | 20,348,657 |
| 10 to 14 years | 51,340 | 375,927 | 20,677,194 |
| 15 to 17 years | 31,988 | 236,505 | 12,954,254 |
| 18 and 19 years | 18,149 | 162,704 | 9,086,089 |
| 20 years | 8,361 | 80,763 | 4,519,129 |
| 21 years | 7,965 | 78,216 | 4,354,294 |
| 22 to 24 years | 25,442 | 227,573 | 12,712,576 |
| 25 to 29 years | 44,636 | 372,347 | 21,101,849 |
| 30 to 34 years | 43,980 | 349,347 | 19,962,099 |
| 35 to 39 years | 46,111 | 345,328 | 20,179,642 |
| 40 to 44 years | 51,954 | 380,338 | 20,890,964 |
| 45 to 49 years | 59,298 | 437,627 | 22,708,591 |
| 50 to 54 years | 58,304 | 436,126 | 22,298,125 |
| 55 to 59 years | 49,519 | 385,986 | 19,664,805 |
| 60 and 61 years | 17,255 | 135,437 | 7,113,727 |
| 62 to 64 years | 22,880 | 178,388 | 9,704,197 |
| 65 and 66 years | 12,158 | 96,316 | 5,319,902 |
| 67 to 69 years | 16,464 | 130,713 | 7,115,361 |
| 70 to 74 years | 21,776 | 173,467 | 9,278,166 |
| 75 to 79 years | 17,418 | 141,252 | 7,317,795 |
| 80 to 84 years | 14,587 | 117,061 | 5,743,327 |
| 85 years and over | 14,243 | 118,505 | 5,493,433 |
| MEDIAN AGE BY SEX | |||
| Both sexes Map | 39.20 | 38.50 | 37.20 |
| Male Map | 38.00 | 37.30 | 35.80 |
| Female Map | 40.30 | 39.60 | 38.50 |
| HOUSEHOLDS | |||
| Total Households Map | 284,605 | 2,279,768 | 116,716,292 |
| HOUSEHOLDS, HOUSEHOLD TYPE | |||
| Family households: Map | 192,506 | 1,468,917 | 77,538,296 |
| Husband-wife family Map | 147,618 | 1,131,344 | 56,510,377 |
| Other family: Map | 44,888 | 337,573 | 21,027,919 |
| Male householder, no wife present Map | 13,684 | 103,625 | 5,777,570 |
| Female householder, no husband present Map | 31,204 | 233,948 | 15,250,349 |
| Nonfamily households: Map | 92,099 | 810,851 | 39,177,996 |
| Householder living alone Map | 75,159 | 642,507 | 31,204,909 |
| Householder not living alone Map | 16,940 | 168,344 | 7,973,087 |
| HOUSEHOLDS, HISPANIC OR LATINO ORIGIN OF HOUSEHOLDER | |||
| Not Hispanic or Latino householder: Map | 268,217 | 2,194,432 | 103,254,926 |
| Hispanic or Latino householder: Map | 16,388 | 85,336 | 13,461,366 |
| HOUSEHOLDS, RACE OF HOUSEHOLDER | |||
| Householder who is White alone | 257,621 | 2,045,544 | 89,754,352 |
| Householder who is Black or African American alone | 12,664 | 122,878 | 14,129,983 |
| Householder who is American Indian and Alaska Native alone | 1,034 | 18,213 | 939,707 |
| Householder who is Asian alone | 3,632 | 35,407 | 4,632,164 |
| Householder who is Native Hawaiian and Other Pacific Islander alone | 83 | 548 | 143,932 |
| Householder who is Some Other Race alone | 6,732 | 35,432 | 4,916,427 |
| Householder who is Two or More Races | 2,839 | 21,746 | 2,199,727 |
| HOUSEHOLDS, HOUSEHOLD TYPE BY HOUSEHOLD SIZE | |||
| Family households: Map | 192,506 | 1,468,917 | 77,538,296 |
| 2-person household Map | 83,745 | 680,856 | 31,882,616 |
| 3-person household Map | 43,704 | 319,637 | 17,765,829 |
| 4-person household Map | 38,498 | 276,516 | 15,214,075 |
| 5-person household Map | 17,116 | 121,740 | 7,411,997 |
| 6-person household Map | 6,179 | 43,643 | 3,026,278 |
| 7-or-more-person household Map | 3,264 | 26,525 | 2,237,501 |
| Nonfamily households: Map | 92,099 | 810,851 | 39,177,996 |
| 1-person household Map | 75,159 | 642,507 | 31,204,909 |
| 2-person household Map | 14,508 | 136,394 | 6,360,012 |
| 3-person household Map | 1,603 | 19,899 | 992,156 |
| 4-person household Map | 578 | 8,016 | 411,171 |
| 5-person household Map | 153 | 2,647 | 126,634 |
| 6-person household Map | 64 | 861 | 48,421 |
| 7-or-more-person household Map | 34 | 527 | 34,693 |
| HOUSING UNITS | |||
| Total Housing Units Map | 315,935 | 2,624,358 | 131,704,730 |
| HOUSING UNITS, OCCUPANCY STATUS | |||
| Occupied Map | 284,605 | 2,279,768 | 116,716,292 |
| Vacant Map | 31,330 | 344,590 | 14,988,438 |
| HOUSING UNITS, OCCUPIED, TENURE | |||
| Owned with a mortgage or a loan Map | 146,153 | 1,082,099 | 52,979,430 |
| Owned free and clear Map | 53,773 | 469,459 | 23,006,644 |
| Renter occupied Map | 84,679 | 728,210 | 40,730,218 |
| HOUSING UNITS, VACANT, VACANCY STATUS | |||
| For rent Map | 7,891 | 63,268 | 4,137,567 |
| Rented, not occupied Map | 377 | 3,695 | 206,825 |
| For sale only Map | 4,507 | 34,219 | 1,896,796 |
| Sold, not occupied Map | 733 | 5,741 | 421,032 |
| For seasonal, recreational, or occasional use Map | 13,338 | 193,046 | 4,649,298 |
| For migrant workers Map | 16 | 249 | 24,161 |
| Other vacant Map | 4,468 | 44,372 | 3,652,759 |
| HOUSING UNITS, OCCUPIED, AVERAGE HOUSEHOLD SIZE BY TENURE | |||
| Total: Map | 2.51 | 2.43 | 2.58 |
| Owner occupied Map | 2.62 | 2.56 | 2.65 |
| Renter occupied Map | 2.23 | 2.16 | 2.44 |
| HOUSING UNITS, OCCUPIED, TENURE BY RACE OF HOUSEHOLDER | |||
| Owner occupied: Map | 199,926 | 1,551,558 | 75,986,074 |
| Householder who is White alone Map | 189,186 | 1,466,172 | 63,446,275 |
| Householder who is Black or African American alone Map | 3,733 | 37,360 | 6,261,464 |
| Householder who is American Indian and Alaska Native alone Map | 510 | 8,742 | 509,588 |
| Householder who is Asian alone Map | 2,198 | 17,078 | 2,688,861 |
| Householder who is Native Hawaiian and Other Pacific Islander alone Map | 49 | 279 | 61,911 |
| Householder who is Some Other Race alone Map | 2,911 | 12,746 | 1,975,817 |
| Householder who is Two or More Races Map | 1,339 | 9,181 | 1,042,158 |
| Renter occupied: Map | 84,679 | 728,210 | 40,730,218 |
| Householder who is White alone Map | 68,435 | 579,372 | 26,308,077 |
| Householder who is Black or African American alone Map | 8,931 | 85,518 | 7,868,519 |
| Householder who is American Indian and Alaska Native alone Map | 524 | 9,471 | 430,119 |
| Householder who is Asian alone Map | 1,434 | 18,329 | 1,943,303 |
| Householder who is Native Hawaiian and Other Pacific Islander alone Map | 34 | 269 | 82,021 |
| Householder who is Some Other Race alone Map | 3,821 | 22,686 | 2,940,610 |
| Householder who is Two or More Races Map | 1,500 | 12,565 | 1,157,569 |
| HOUSING UNITS, OCCUPIED, TENURE BY HISPANIC OR LATINO ORIGIN OF HOUSEHOLDER | |||
| Owner occupied: Map | 199,926 | 1,551,558 | 75,986,074 |
| Not Hispanic or Latino householder Map | 191,937 | 1,516,656 | 69,617,625 |
| Hispanic or Latino householder Map | 7,989 | 34,902 | 6,368,449 |
| Renter occupied: Map | 84,679 | 728,210 | 40,730,218 |
| Not Hispanic or Latino householder Map | 76,280 | 677,776 | 33,637,301 |
| Hispanic or Latino householder Map | 8,399 | 50,434 | 7,092,917 |
| HOUSING UNITS, OCCUPIED, TENURE BY HOUSEHOLD SIZE | |||
| Owner occupied: Map | 199,926 | 1,551,558 | 75,986,074 |
| 1-person household Map | 40,214 | 325,993 | 16,453,569 |
| 2-person household Map | 75,956 | 623,027 | 27,618,605 |
| 3-person household Map | 33,164 | 241,709 | 12,517,563 |
| 4-person household Map | 30,727 | 220,084 | 10,998,793 |
| 5-person household Map | 13,084 | 91,979 | 5,057,765 |
| 6-person household Map | 4,523 | 31,002 | 1,965,796 |
| 7-or-more-person household Map | 2,258 | 17,764 | 1,373,983 |
| Renter occupied: Map | 84,679 | 728,210 | 40,730,218 |
| 1-person household Map | 34,945 | 316,514 | 14,751,340 |
| 2-person household Map | 22,297 | 194,223 | 10,624,023 |
| 3-person household Map | 12,143 | 97,827 | 6,240,422 |
| 4-person household Map | 8,349 | 64,448 | 4,626,453 |
| 5-person household Map | 4,185 | 32,408 | 2,480,866 |
| 6-person household Map | 1,720 | 13,502 | 1,108,903 |
| 7-or-more-person household Map | 1,040 | 9,288 | 898,211 |
Loading...